On this page
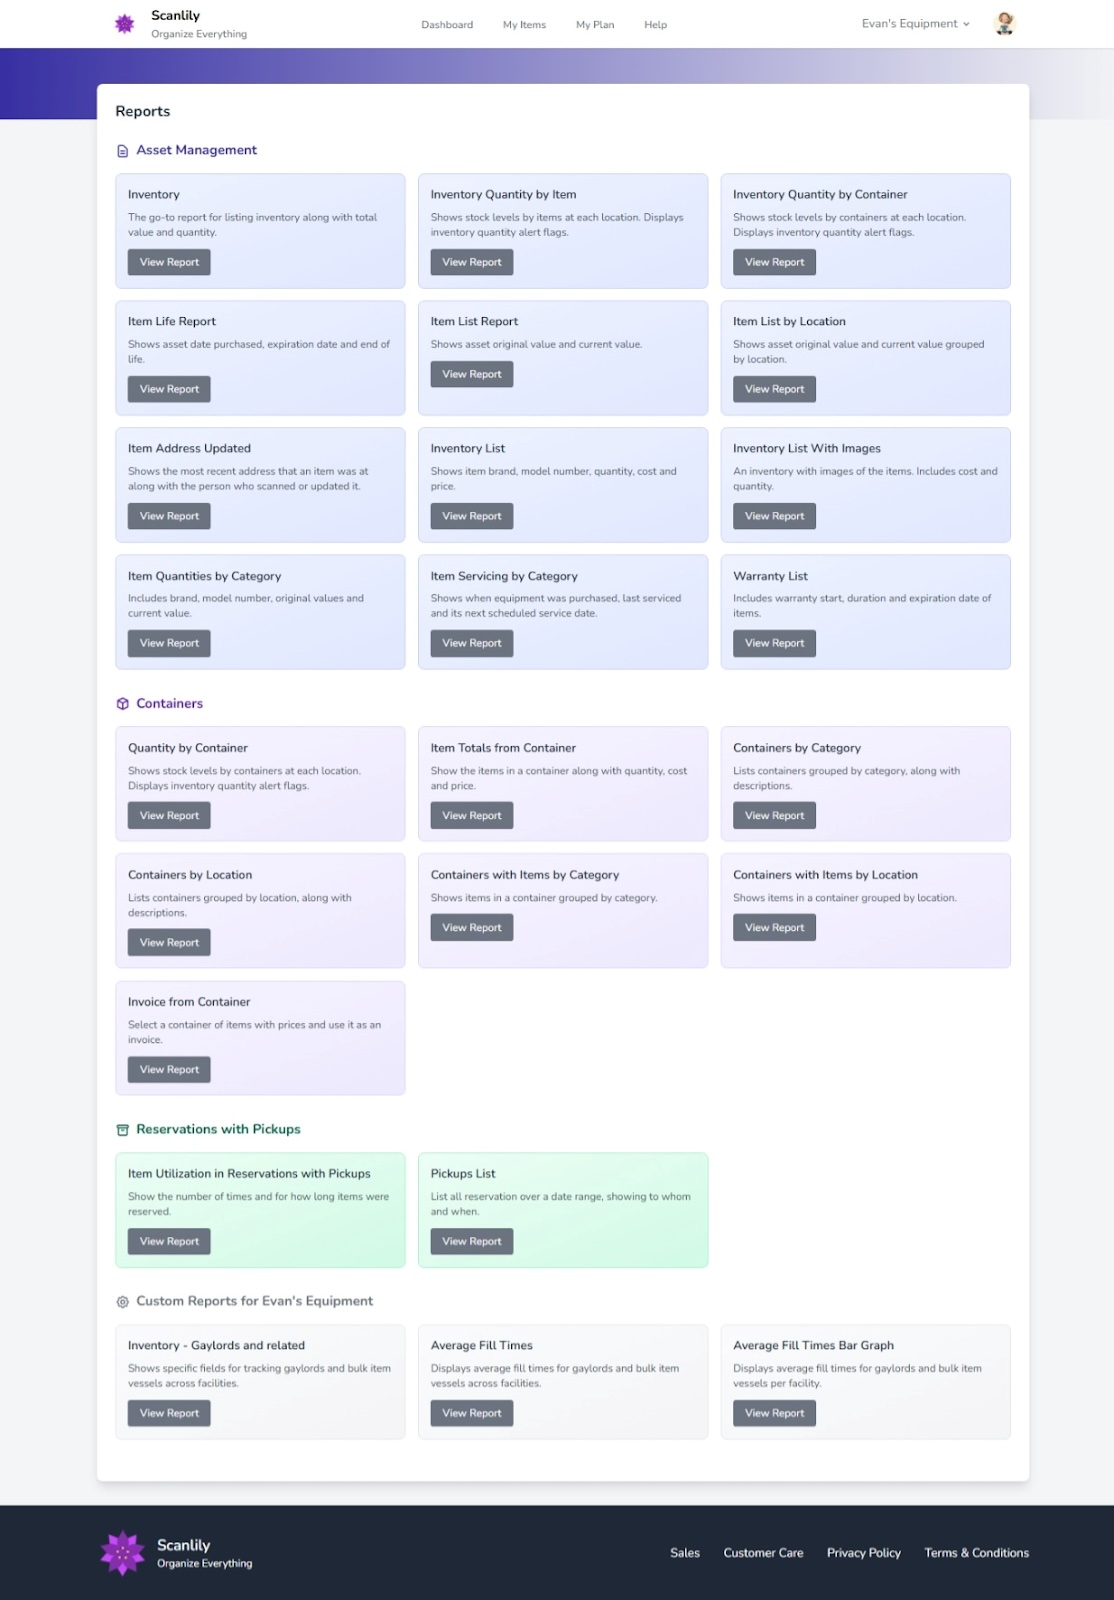
Scanlily’s reports are accessible to Business subscribers by logging in to the User Website and selecting Reports.
Reports have a number of parameters on top that you can select from in order to constrain, group or sort your results.
The following are reports in the Asset Management category:
a. Inventory Report
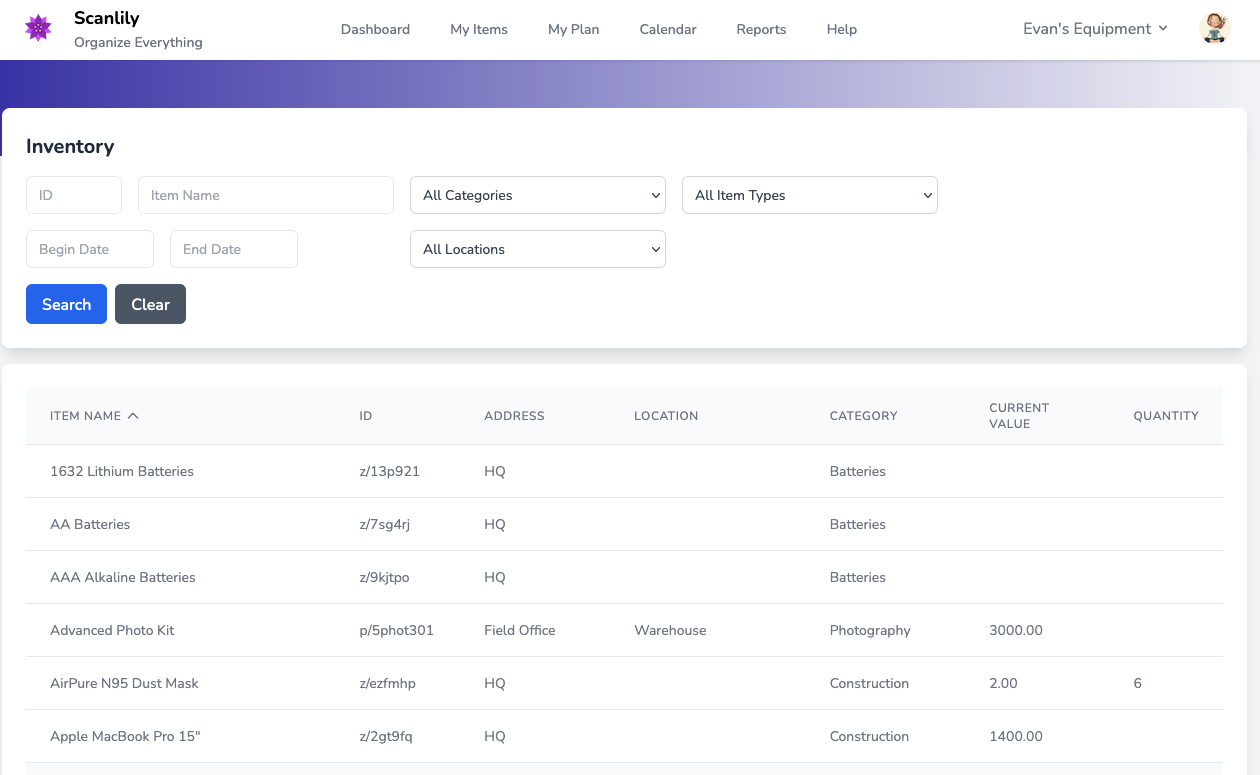
The go-to report for listing inventory along with total value and quantity.
b. Inventory Quantity by Item
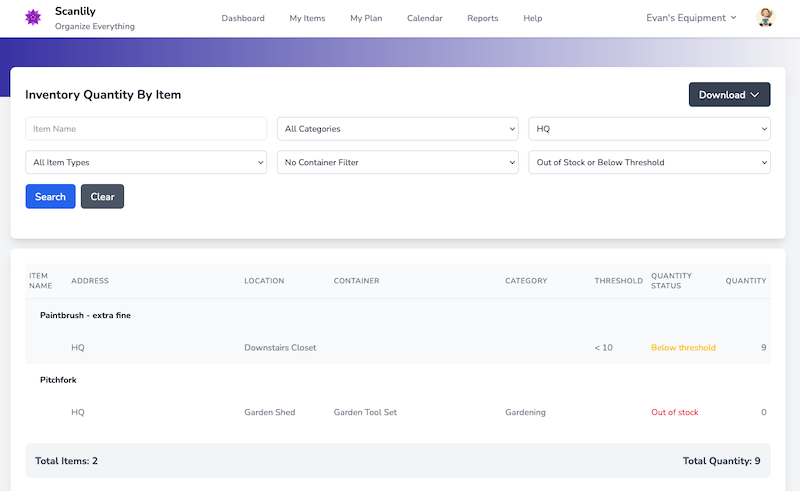
Shows stock levels by items at each location. Displays inventory quantity alert flags.
c. Inventory Quantity by Container
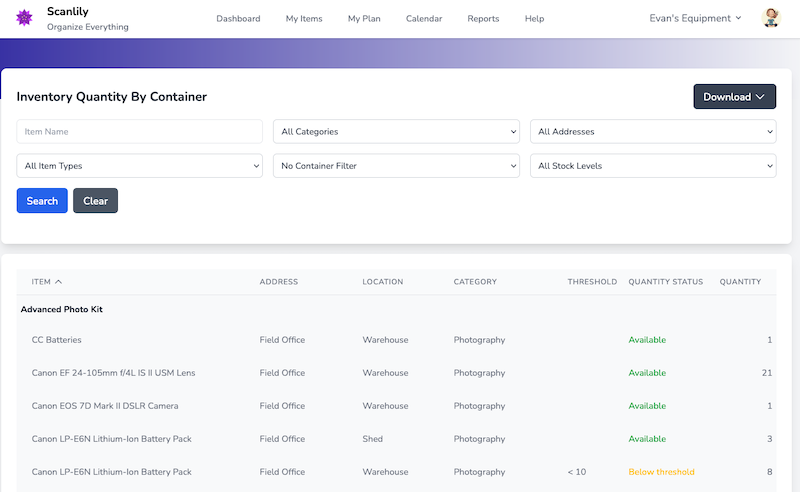
Shows stock levels by containers at each location. Displays inventory quantity alert flags.
d. Item Life Report
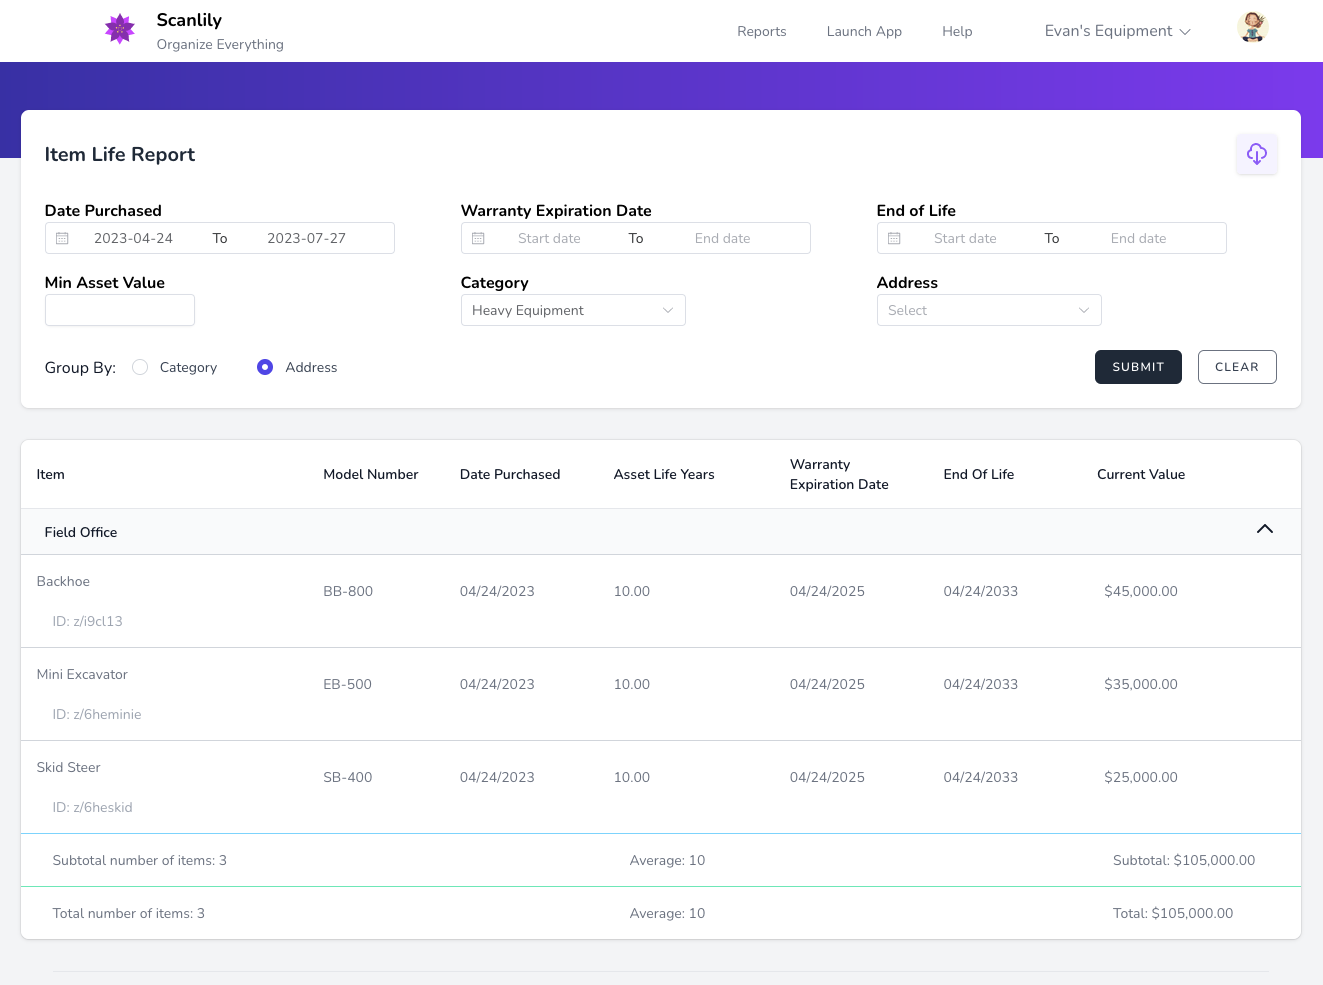
Shows asset date purchased, expiration date and end of life.
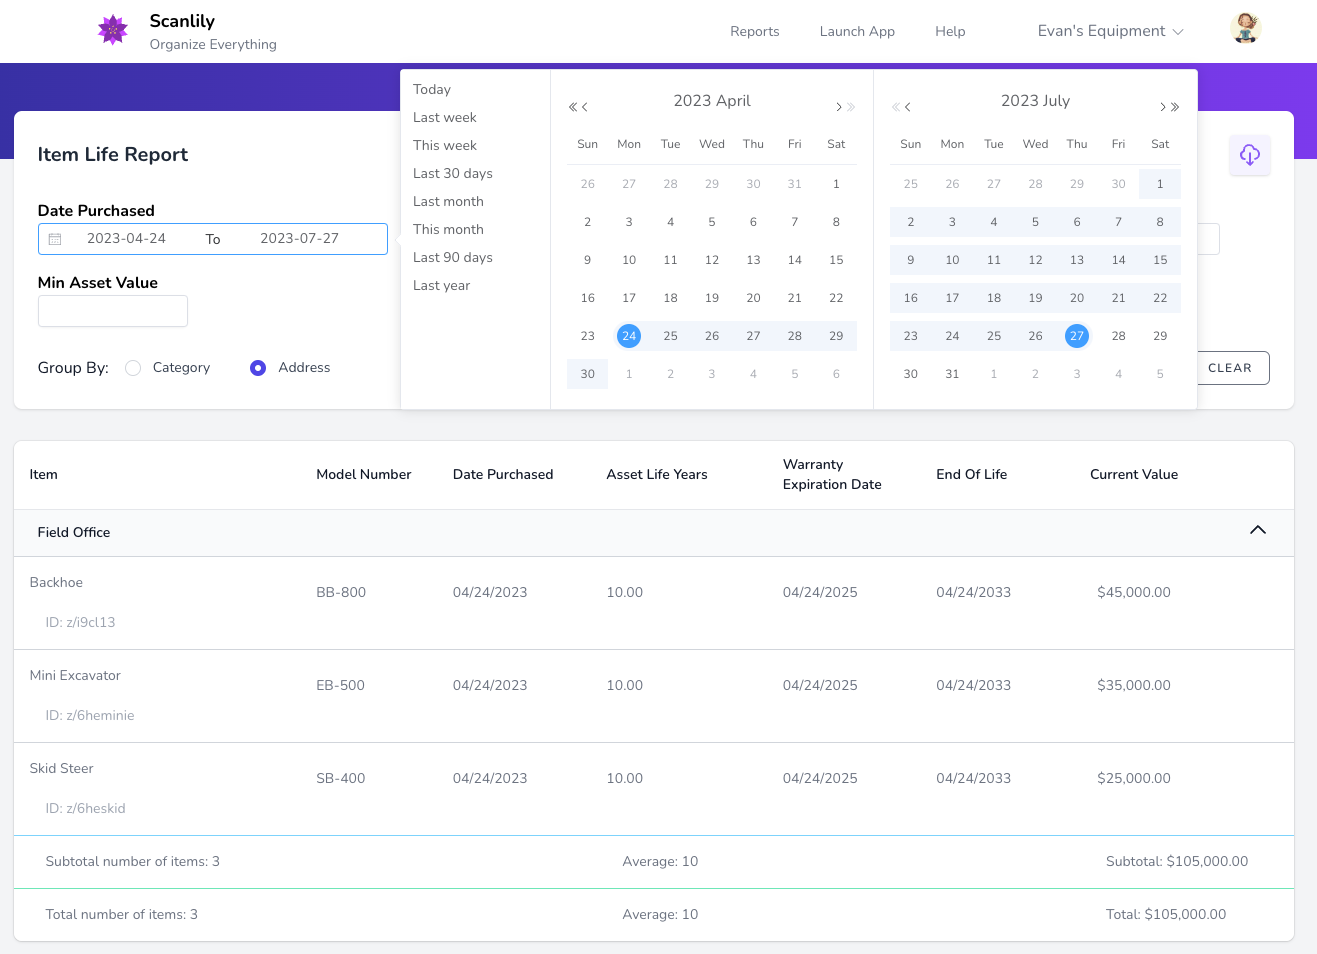
If you click on the date range on this and other reports, you can specify not only a specific date range but also run reports for the last week, last month, etc:
Scanlily is very handy as an Asset Management System due to the various easy-to-use reports that help you track your asset value and asset life.
The rest of this section describes some other Scanlily reports - though there are many more available to meet specific needs.
e. Item List Report
Shows asset original value and current value.
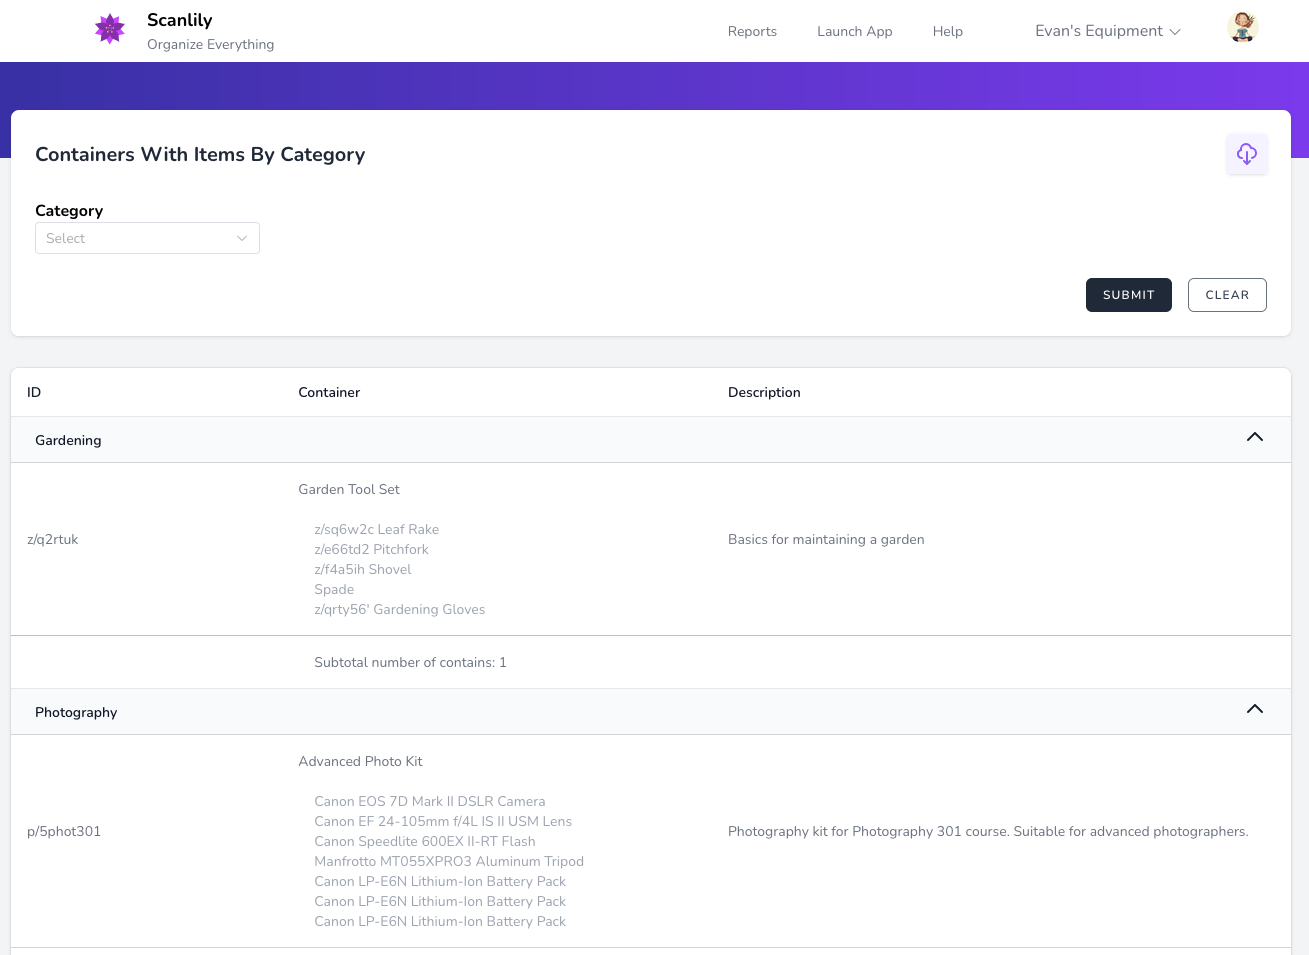
All reports have an export capability. Click on the upper right to print the results to a PDF or export to a CSV or Excel file.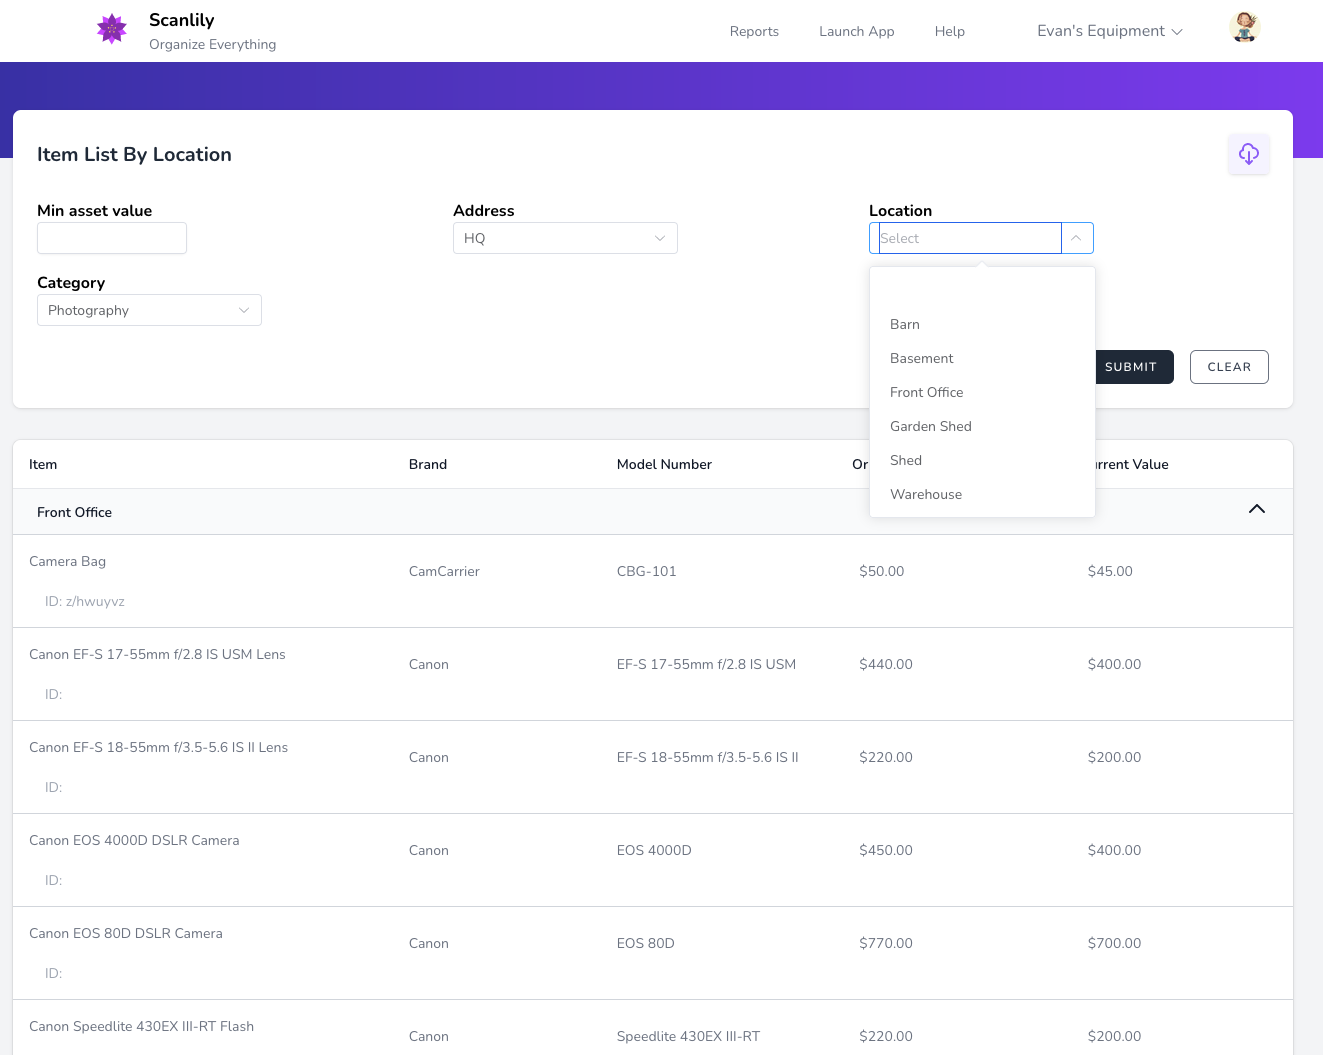
f. Item List by Location Report
Shows asset original value and current value grouped by location.
Location is a common selection option for reports, as is Address and Category. Click one and select from a pulldown of the groupings you have defined in the app.
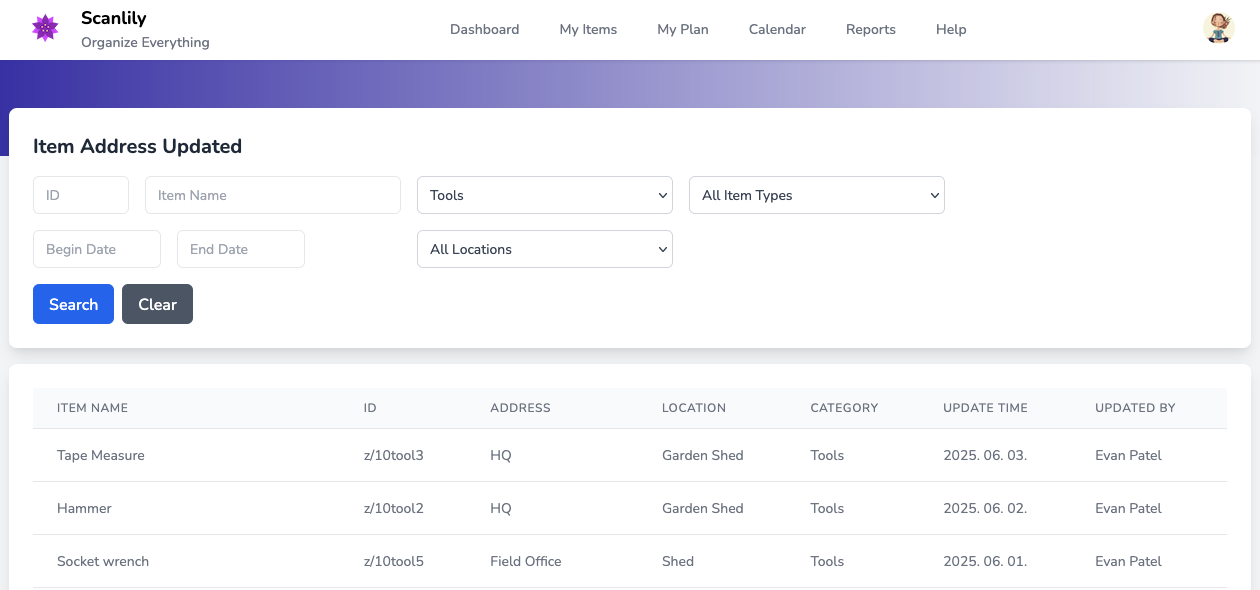
g. Item Address Updated
Shows the most recent address that an item was at along with the person who scanned or updated it.
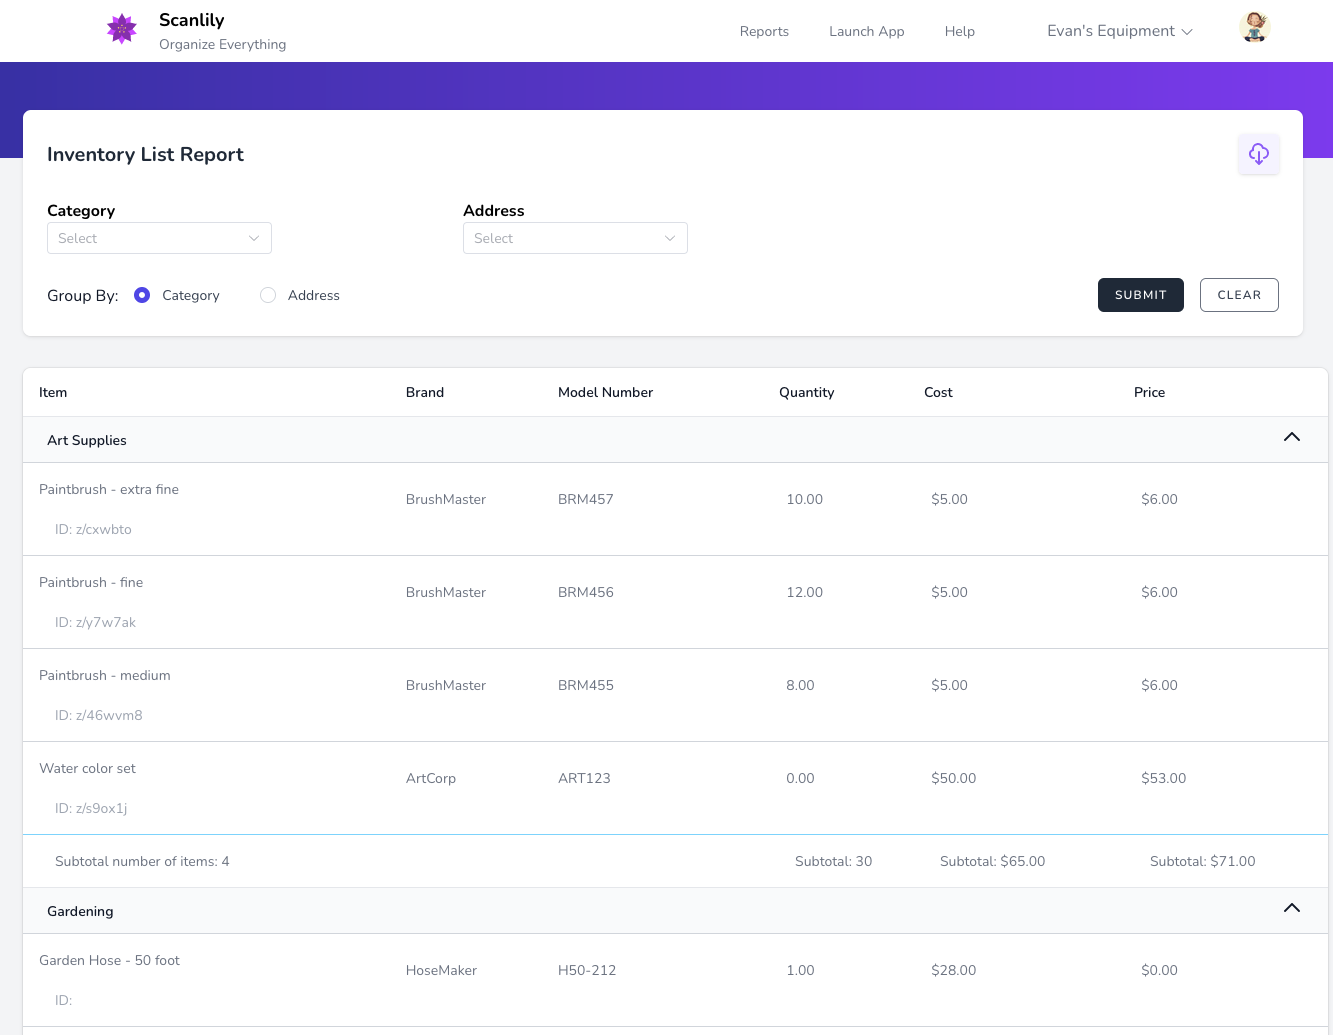
h. Inventory List Report
Shows item brand, model number, quantity, cost and price.
Many reports allow you to Group By Category or Address, such as the Inventory List Report:
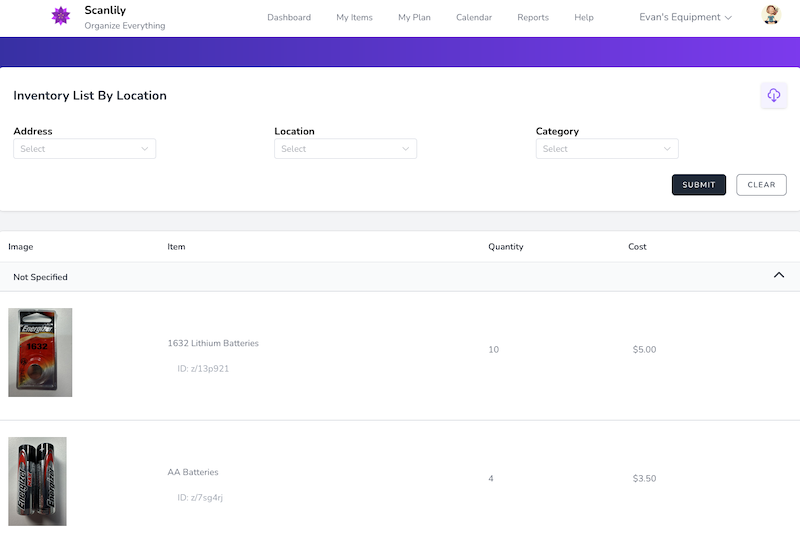
i. Inventory List with Images
An inventory with images of the items. Includes cost and quantity.
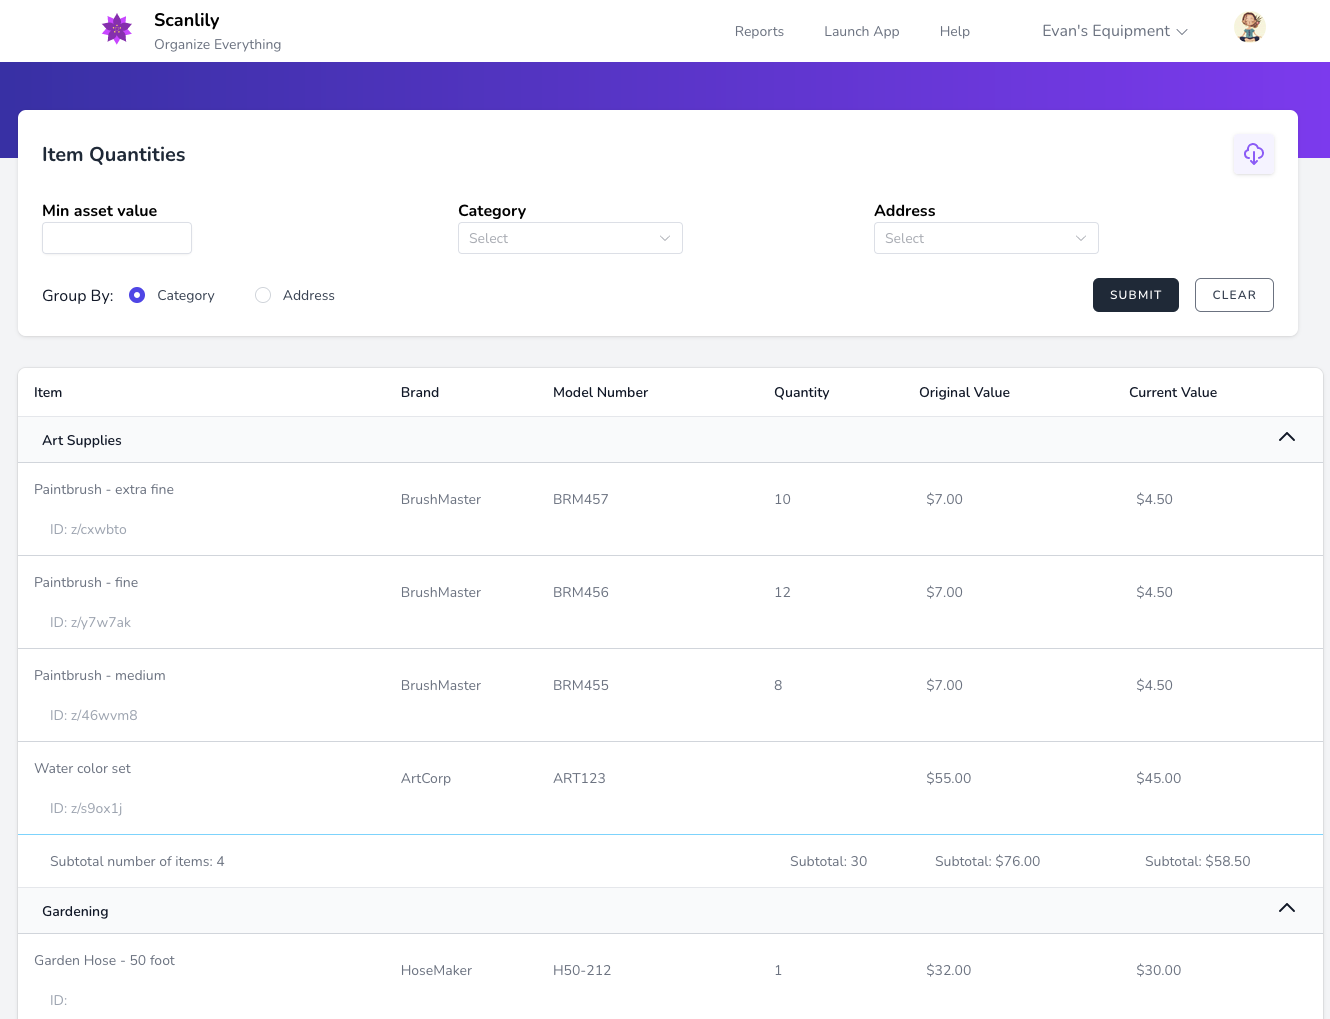
j. Item Quantities Report
When a quantity is blank in a report, that means the quantity is assumed to be 1 but is not being tracked for that item. If you want to see a quantity on the report, then using the app change the quantity from blank to a positive number or to zero.
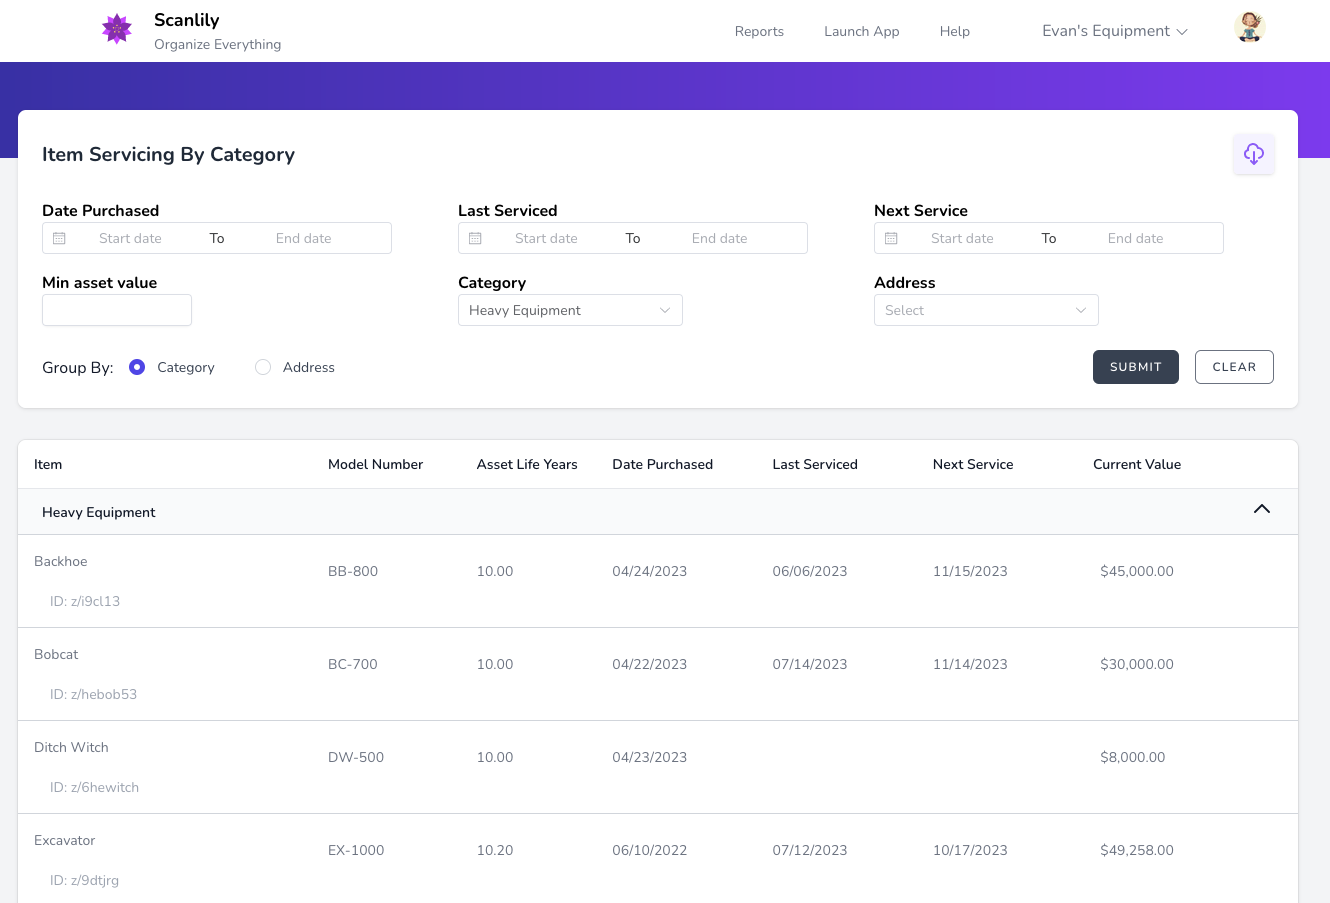
k. Item Servicing by Category Report
As an Equipment Management System, Scanlily allows you to track when your item was last serviced and when it is due for servicing. You can use the reminder feature to receive reminder notifications and stay on top of item maintenance.
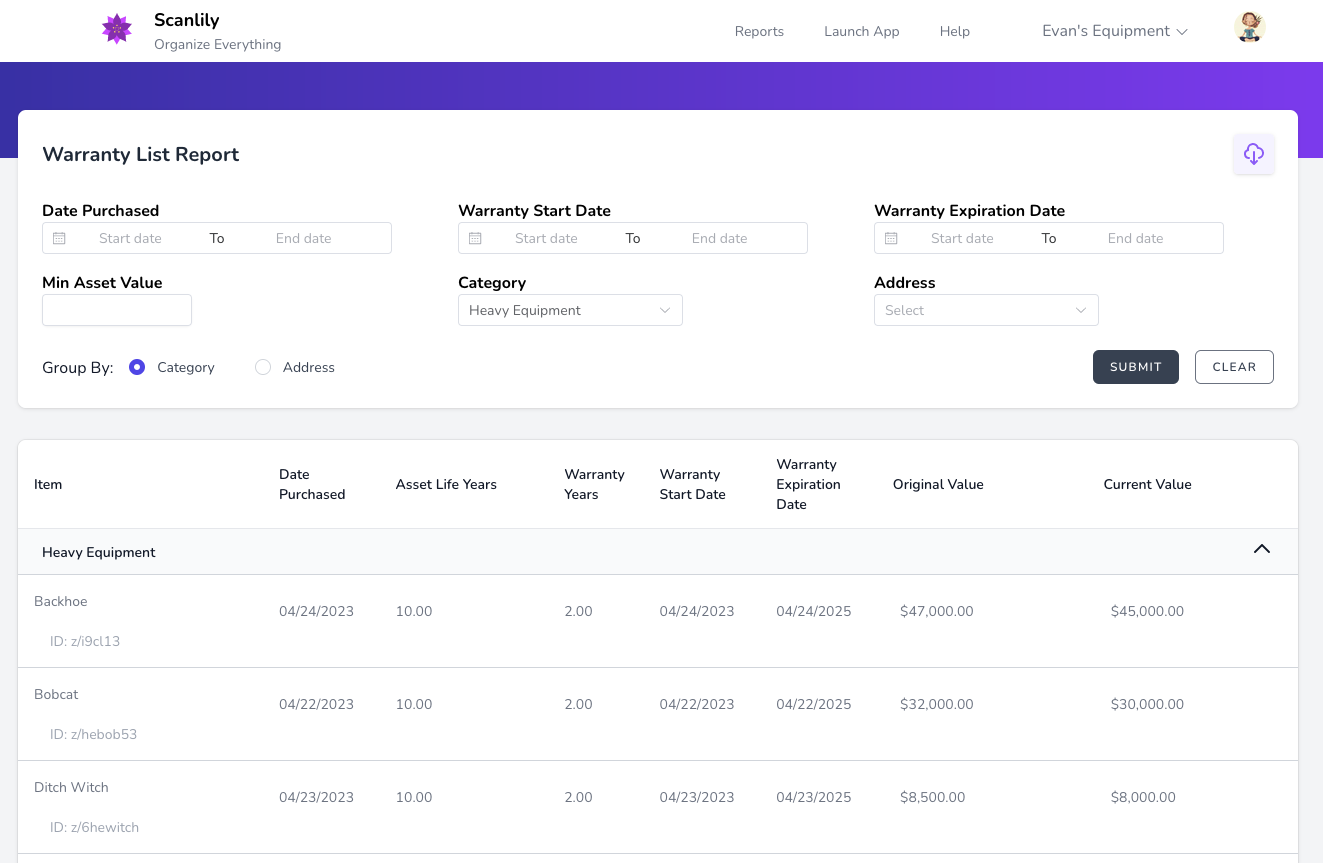
l. Warranty List Report
Scanlily is useful as a Warranty Management System. You can set email reminders to notify you when warranties are close to expiring for your various assets.
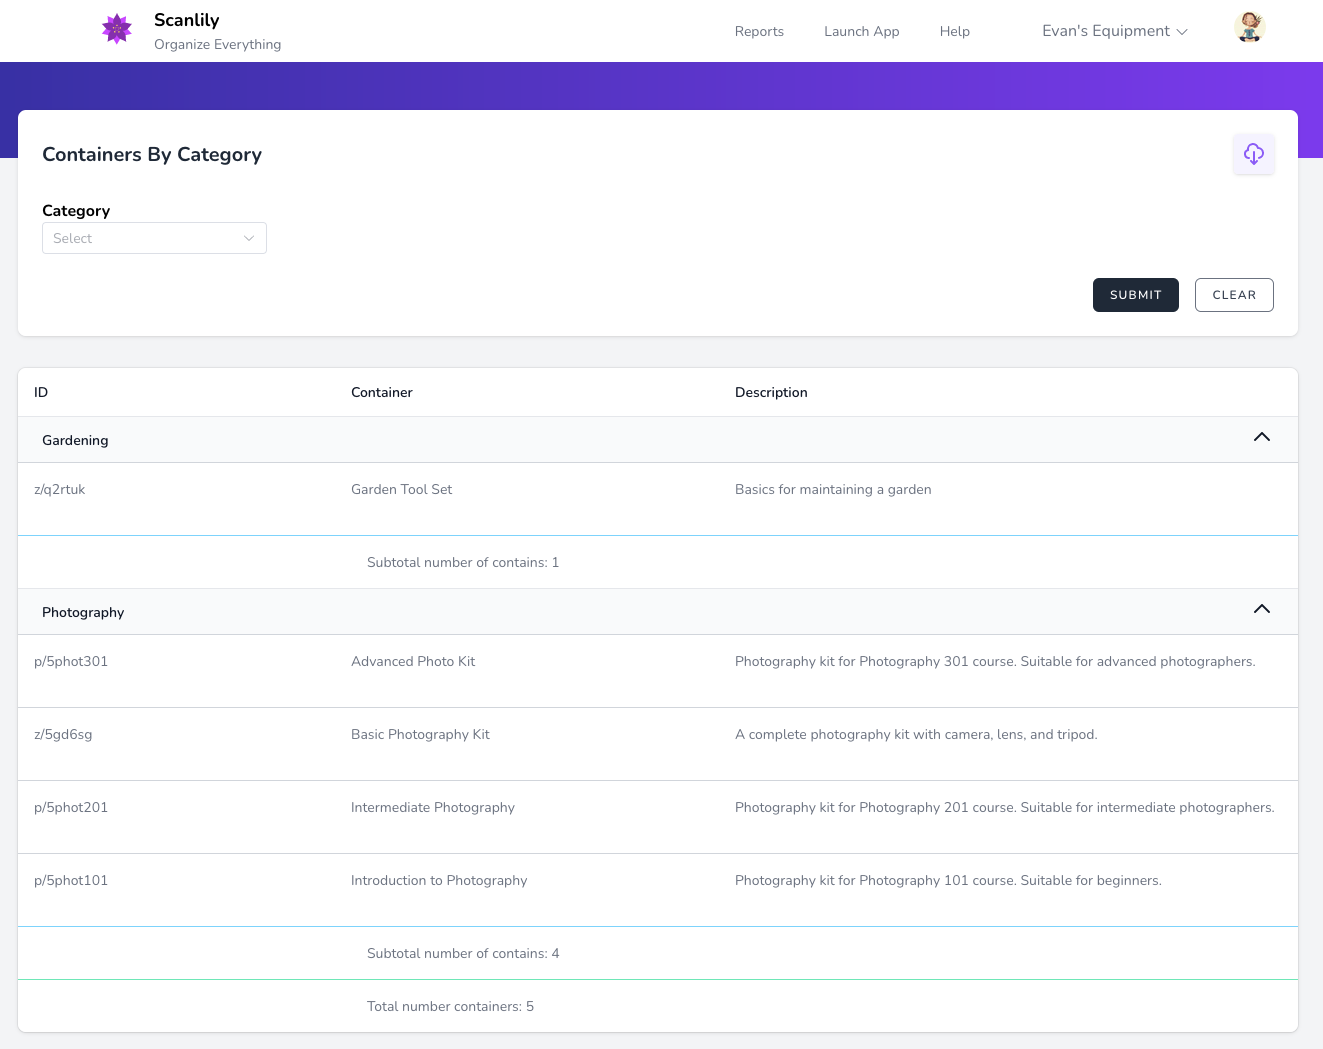
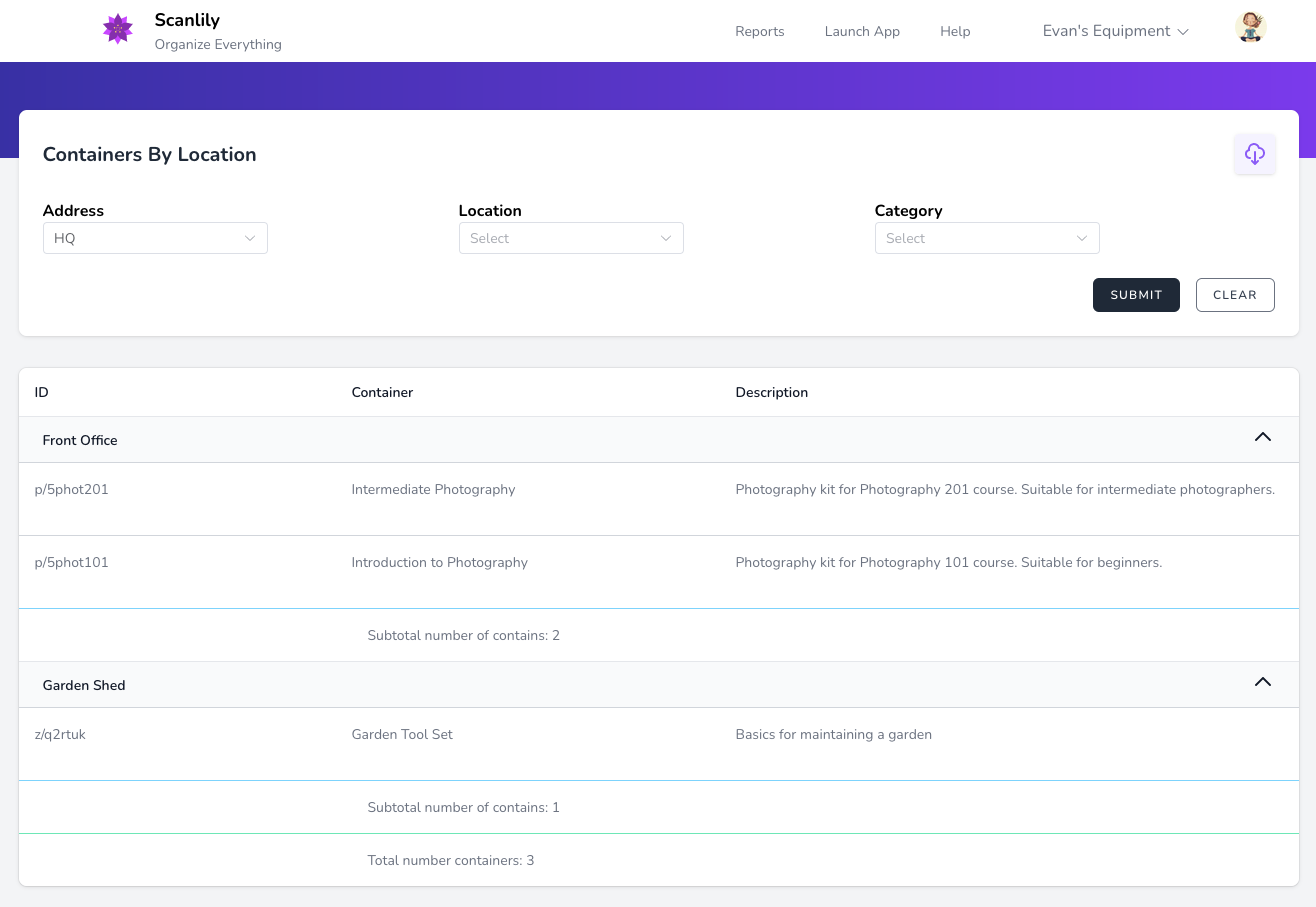
m. Container Reports
Scanlily has various reports to help you keep track of your Containers.
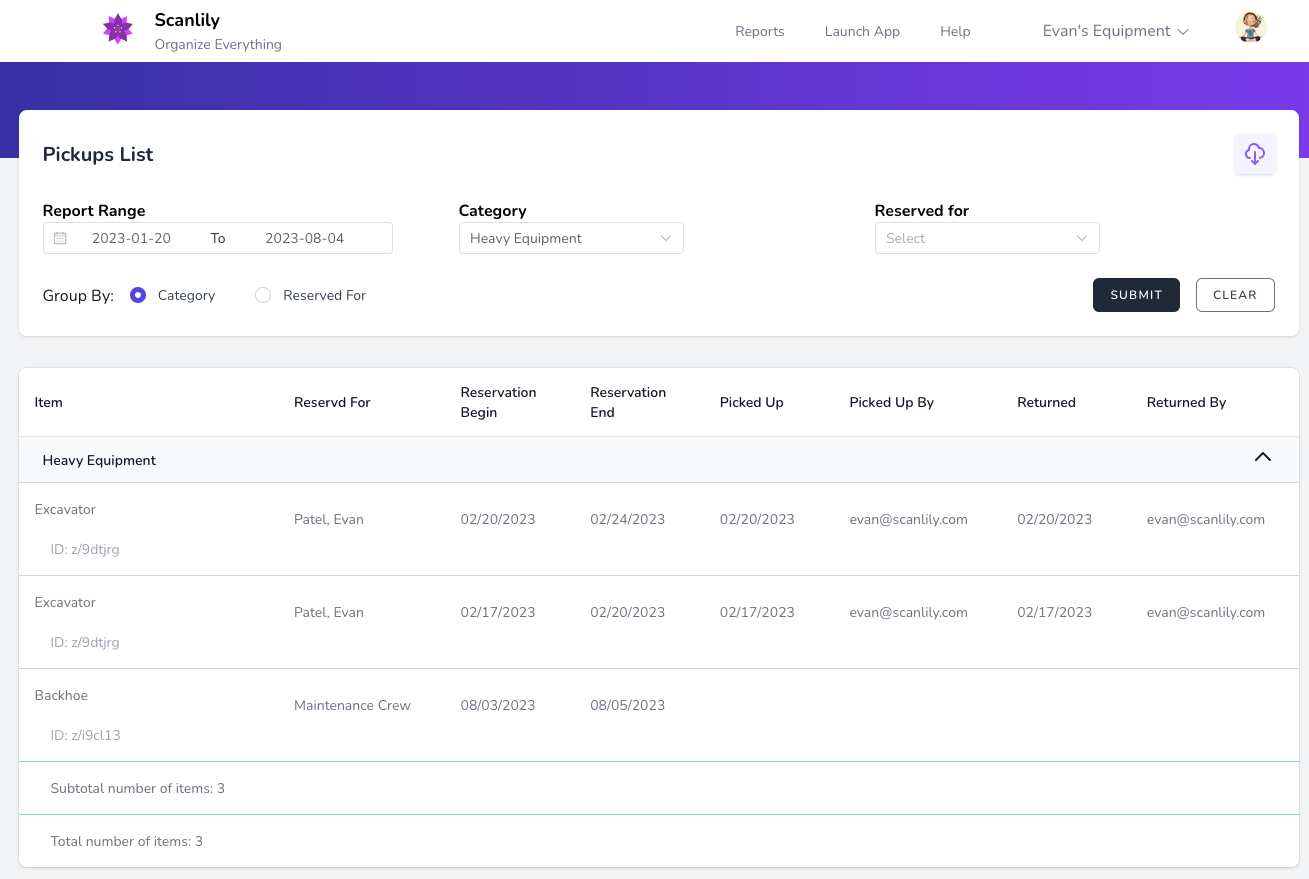
n. Bookings List Report
Depending on your booking mode, you can run a report listing your Checkouts, Reservations, or Reservations with Pickups. This supplements the many ways of viewing bookings from within the app and is especially useful for historical reporting.
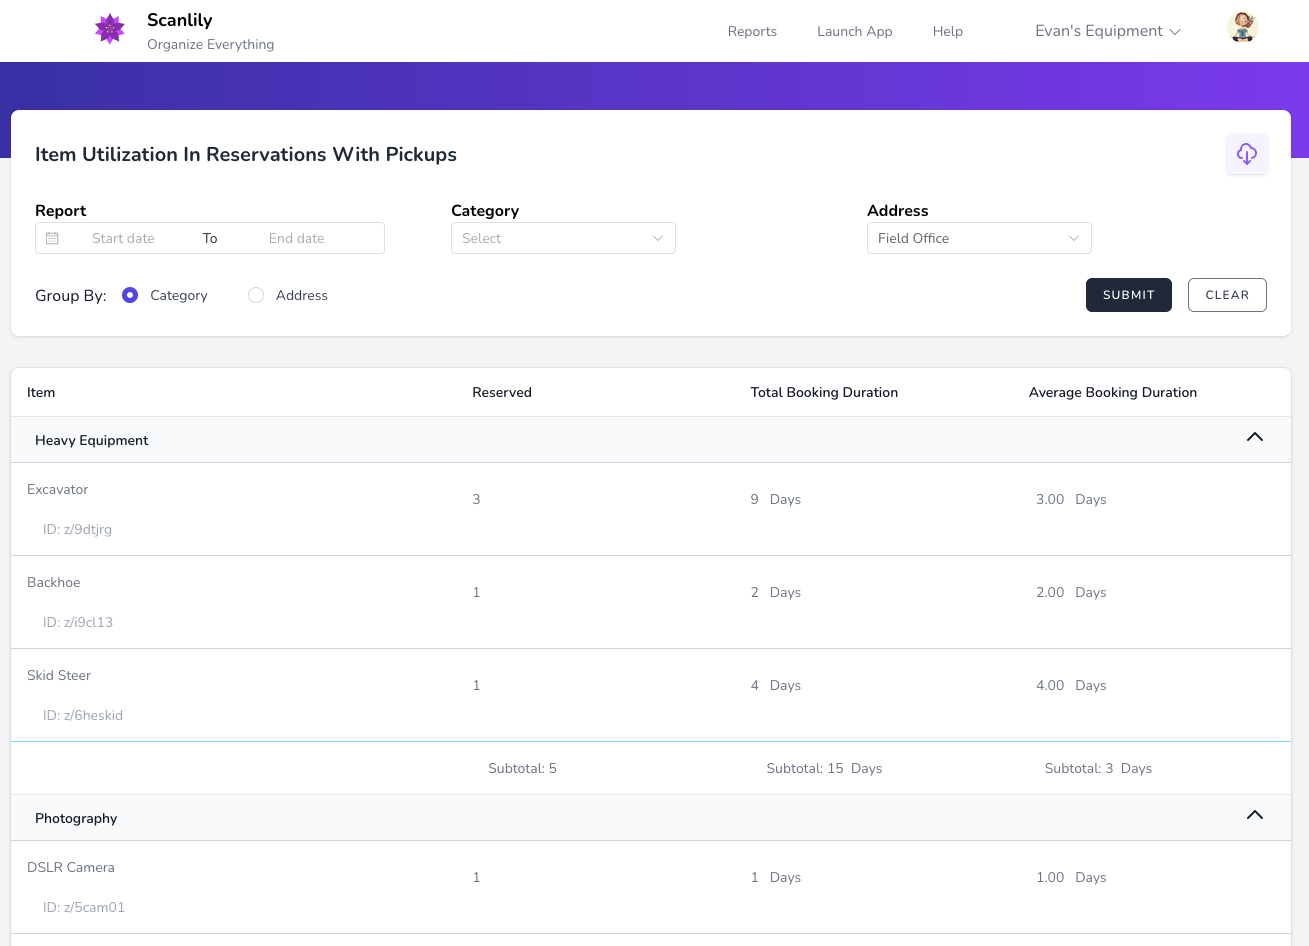
o. Item Utilization in Reservations Report
For Equipment Management, it is helpful to know what items are reserved the most and how long they are reserved in total and on average. The Item Utilization in Reservations report handily conveys this information.